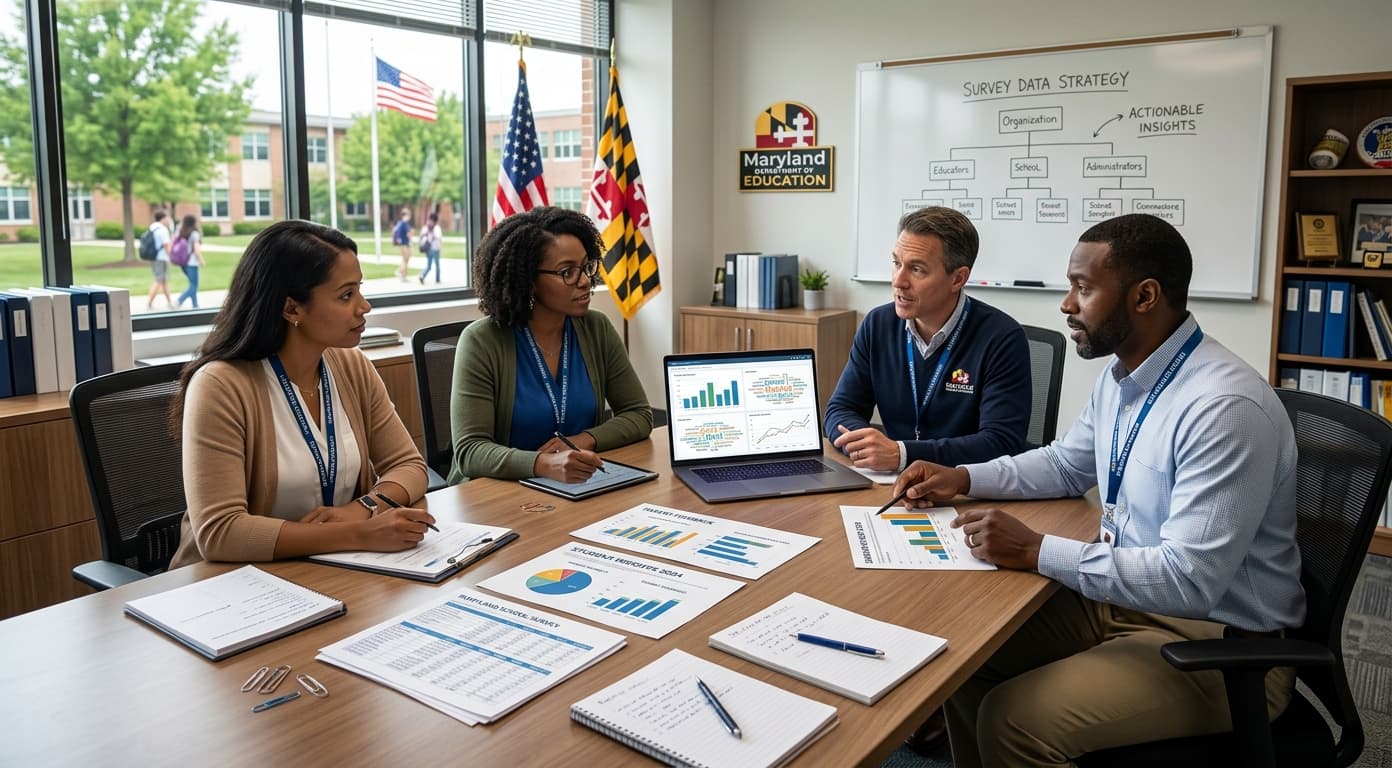
School feedback often provides valuable insights, yet scattered responses can make those insights difficult to use. Gamma helps teams organize survey findings into clear, engaging presentations. However, schools still need thoughtful processes before turning responses into meaningful decisions. A well-designed Maryland school survey can reveal concerns about learning, communication, safety, and student experiences. Nevertheless, raw responses rarely provide immediate solutions. Administrators must organize, compare, and interpret the information carefully. Otherwise, important patterns can remain hidden inside lengthy spreadsheets and disconnected notes.
Why School Survey Results Become Difficult to Manage
Schools often collect feedback from students, parents, teachers, and staff. Each group can highlight different experiences and priorities. Consequently, administrators may receive hundreds of responses with conflicting opinions.
Too Much Information
Large surveys can produce overwhelming amounts of qualitative and quantitative information. Reading every response manually also consumes valuable administrative time. Furthermore, teams may struggle to identify findings that deserve immediate attention. Important concerns can become buried beneath repetitive comments and minor suggestions.
Unclear Priorities
Survey responses do not automatically reveal which problems matter most. Therefore, schools need clear categories for organizing feedback. For example, administrators can group responses around communication, facilities, teaching, technology, and student wellbeing. This approach makes recurring themes easier to recognize..
Confusing Data Presentation
Even useful findings can lose impact when teams present them poorly. Long spreadsheets often make comparisons difficult for busy decision-makers. Instead, schools should present important findings through concise summaries, charts, and clearly labeled sections. Visual organization can help stakeholders understand information faster.
How to Get More Value From a Maryland School Survey
A structured process can turn survey responses into practical insights. Start by defining the main questions before reviewing results.
1. Identify the Main Objectives
First, determine what the survey should help your school understand. Keep those objectives specific and measurable. For instance, you might measure parent satisfaction with school communication. Alternatively, you could evaluate student opinions about classroom technology. Clear objectives prevent teams from getting distracted by unrelated responses.
2. Organize Responses Into Themes
Next, group similar answers into meaningful categories. Use consistent labels across the entire dataset. You can create categories for academics, communication, facilities, activities, and school culture. Then, compare responses within each category. This process makes repeated concerns easier to spot. It also helps administrators distinguish isolated opinions from broader patterns.
3. Separate Trends From Outliers
Not every unusual response represents a widespread problem. Therefore, compare individual comments against overall response patterns. Look for repeated concerns across different groups. Also, examine whether specific issues appear within particular grades or communities. This approach creates a more balanced interpretation of the Maryland school survey results.
4. Turn Findings Into Actions
Survey analysis becomes valuable when it leads to practical improvements. After identifying major themes, connect each finding with a possible action. For example, repeated communication concerns may support a new parent update system. Similarly, technology complaints may justify reviewing classroom equipment. Always assign clear responsibilities and timelines. Otherwise, survey findings can remain informative without producing meaningful change.
Avoid Confusing Keywords and Unrelated Information
Schools and organizations sometimes use online tools to research survey topics. However, keyword research can introduce unrelated terms into planning documents. Terms such as adaps and bazopril may appear during unrelated searches or data collection. Therefore, teams should verify unfamiliar terms before including them in reports. A simple review process can prevent irrelevant information from affecting conclusions. Always confirm the source, context, and relevance of unusual terms. This practice becomes especially important when teams combine survey research with online research. Clear filtering keeps reports focused and easier to understand.
Make Survey Findings Easier to Present
Once teams understand the data, presentation becomes the next challenge. Stakeholders usually need concise information rather than pages of raw responses.
Create a Clear Story
Start with the most important finding. Then, explain supporting evidence and possible actions. For example, begin with the strongest satisfaction trend. Follow it with key concerns and recommended improvements. This structure gives decision-makers a clear path from evidence to action.
Use Visual Summaries
Charts can make comparisons easier to understand. Meanwhile, short summaries can explain what each visual means. Avoid filling slides with excessive text. Instead, highlight numbers and observations that directly support your recommendations.
Keep Stakeholders Focused
Different audiences need different levels of detail. Teachers may need detailed feedback, while leaders may prefer broader trends. Therefore, tailor your presentation to the people making decisions. A focused presentation can encourage faster discussions and clearer next steps.
How Gamma Can Simplify Survey Presentations
Gamma can provide a practical way to transform organized findings into polished, shareable presentations. Instead of spending excessive time formatting sections, teams can focus on their message. You can structure survey findings around major themes, supporting evidence, and recommended actions. Then, present those insights through an easier-to-follow visual format. This approach can help schools communicate findings without overwhelming their audience. It also makes complex information easier to discuss during meetings and planning sessions.
Benefits of a More Structured Approach
A better survey workflow offers several practical advantages. First, teams can spend less time searching through scattered responses. Second, stakeholders can understand major findings more quickly. Additionally, organized presentations can encourage more focused conversations. Most importantly, schools can connect feedback with specific actions. That connection turns surveys into useful decision-making tools.
Conclusion
A Maryland school survey can reveal powerful insights when teams analyze responses with purpose. However, schools need clear organization, careful filtering, and focused communication. Gamma can help teams turn structured findings into engaging presentations without unnecessary formatting work. Meanwhile, reviewing terms like adaps and bazopril prevents irrelevant information from influencing research. Ultimately, better survey management starts with better organization. When schools present evidence clearly, stakeholders can understand concerns and support smarter improvements.